Making A Tiny E-Paper Status Display for the Raspberry Pi Zero
Later: eBook of Dreams
Earlier: In Praise of Small Shell Scripts
I've gotten interested in Raspberry Pis again, having recently picked up a Pi Zero 2 W. Something about these cheap little boards that are fully-functional Linux computers, "as powerful" as the VAXes I originally learned Unix on, appeals to the young hacker in me who fell in love with computers in the 1980s and is still able to be amazed by their potential. I've also been trying to get more comfortable doing hardware projects, tinkering with an Arduino kit and brushing up on the electronics I learned in college.
For my first "finished" project I wanted to work with an e-paper (also known as e-ink) display. These displays, used in most eBook readers such as the Kindle, Nook, Kobo, etc., are great for low-power applications, where information updates relatively infrequently, where an external light source is available, and where monochrome output is suitable. Personally, I prefer no backlight and monochrome output, frequently setting my iPhone screen to greyscale as a way of reducing its stranglehold on my attention.
I like the idea of building devices which truly fade into the background rather than being sources of interruption. Devices that don't tell you things directly, but rather invite you to look their way when you care to. I thought an enjoyable first project might be a little computer that just quietly tells you about itself and doesn't do much else. Tangentially, this relates to a movement known as "calm technology" which advocates for presenting information less invasively, often in subliminal ways ("under the threshold of consciousness").
This post records what I needed to do to build such a small e-paper-based device. Since there were a lot of details I'm likely to forget down the road, I used Literate DevOps in Org Mode from this document to be able to run and record (and re-run) most of the steps while editing the document itself (see the linked blog post for an explanation).
Supply List
I used the following:
- Vilros Raspberry Pi Zero 2 W Basic Starter Kit
- 2.13 inch e-paper HAT from Waveshare
- 128 GB MicroSD card (way overkill)
- Solder and soldering iron
I highly recommmend the Vilros kit - it was beautifully packaged and had everything I needed. I did have to solder the 40-pin GPIO connector onto the Pi Zero.
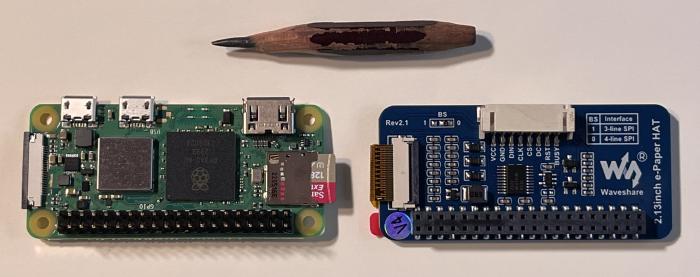
Total cost was about $80, not counting the new soldering iron I had to purchase after my old Radio Shack soldering iron shorted out, though I could have saved money by buying a smaller SD card.
The Waveshare product is reasonably well-documented, though they recommend some steps I think are best avoided or changed. The software setup I used is shown next. (The rest of this post is somewhat technical – skip to the end if you just want to see the pictures.)
Dependencies
In honor of particle astrophysics, I gave the computer the name
pion. It runs Raspbian, which is a Debian variant.
Virtualenv-based setup
I prefer not to install Python dependencies into system directories,
because it's better to isolate sets of dependencies across different
applications; the venv module creates virtual environments
("virtualenvs") which do this. Also, Waveshare's guide recommends
numpy, which is a heavyweight dependency I prefer to avoid unless I
need it, and as far as I can tell, we do not. My dependency
installation steps were as follows (here and below, the command that
was issued has a grey background, and the output has a tan-colored
background):
# On pion:
sudo apt-get update -qq
sudo apt-get install -yqq python3-pip
python -m venv venv
source venv/bin/activate
pip install -U -q setuptools
pip install -q spidev
pip install -q gpiozero
pip install -q pillow
Selecting previously unselected package python3-pip. (Reading database ... [...progress info elided...] Preparing to unpack .../python3-pip_23.0.1+dfsg-1+rpt1_all.deb ... Unpacking python3-pip (23.0.1+dfsg-1+rpt1) ... Setting up python3-pip (23.0.1+dfsg-1+rpt1) ... Processing triggers for man-db (2.11.2-2) ...
Running the Demo
Once the hardware was attached and the dependencies loaded, I had some hope of interacting with the device. The next step was to check out the Waveshare e-paper repository from GitHub…
git clone -q https://github.com/waveshare/e-Paper.git… and then to try to run their demo script:
cd e-Paper/RaspberryPi_JetsonNano/python/examples
source ~/venv/bin/activate && python epd_2in13_V3_test.py
/home/rpi/venv/lib/python3.11/site-packages/gpiozero/devices.py:295: PinFactoryFallback: Falling back from lgpio: No module named 'lgpio' warnings.warn( /home/rpi/venv/lib/python3.11/site-packages/gpiozero/devices.py:295: PinFactoryFallback: Falling back from rpigpio: No module named 'RPi' warnings.warn( /home/rpi/venv/lib/python3.11/site-packages/gpiozero/devices.py:295: PinFactoryFallback: Falling back from pigpio: No module named 'pigpio' warnings.warn( /home/rpi/venv/lib/python3.11/site-packages/gpiozero/devices.py:292: NativePinFactoryFallback: Falling back to the experimental pin factory NativeFactory because no other pin factory could be loaded. For best results, install RPi.GPIO or pigpio. See https://gpiozero.readthedocs.io/en/stable/api_pins.html for more information. warnings.warn(NativePinFactoryFallback(native_fallback_message)) INFO:root:epd2in13_V3 Demo INFO:root:init and Clear DEBUG:waveshare_epd.epd2in13_V3:e-Paper busy DEBUG:waveshare_epd.epd2in13_V3:e-Paper busy release DEBUG:waveshare_epd.epd2in13_V3:e-Paper busy DEBUG:waveshare_epd.epd2in13_V3:e-Paper busy release DEBUG:waveshare_epd.epd2in13_V3:e-Paper busy DEBUG:waveshare_epd.epd2in13_V3:e-Paper busy release DEBUG:waveshare_epd.epd2in13_V3:e-Paper busy DEBUG:waveshare_epd.epd2in13_V3:e-Paper busy release DEBUG:waveshare_epd.epd2in13_V3:e-Paper busy DEBUG:waveshare_epd.epd2in13_V3:e-Paper busy release INFO:root:1.Drawing on the image... DEBUG:waveshare_epd.epd2in13_V3:e-Paper busy [... lots more debugging info here...] DEBUG:waveshare_epd.epd2in13_V3:e-Paper busy release INFO:root:Goto Sleep... DEBUG:waveshare_epd.epdconfig:spi end DEBUG:waveshare_epd.epdconfig:close 5V, Module enters 0 power consumption ...
When I did this I saw their series of changes on the small screen attached to the RPi Zero. Exciting! (The warnings in the output seem to have to do w/ how the Python code wants to "speak GPIO" and does not seem to negatively effect the outcome.)
Rolling Our Own
I wanted to make my own display, and simply load the Waveshare driver
code as a Python package. Unfortunately, I was unable to get
Waveshare's (undocumented) setup.py working with my virtualenv; the
quick-and-dirty workaround was to update sys.path to find their
library, but use the virtualenv for the other dependencies installed
earlier.
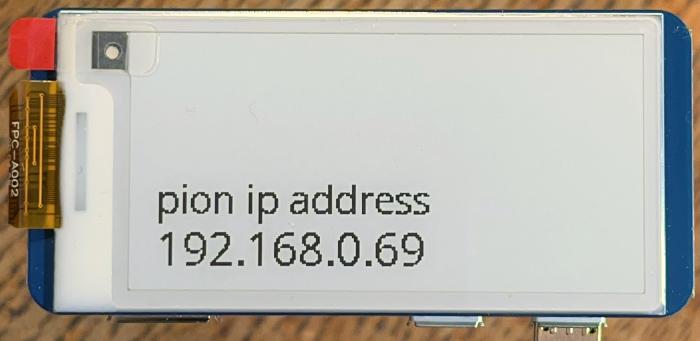
As a proof of concept, I wrote a script to write the device IP address to the screen:
# On pion:
cat <<EOF > /tmp/ip-demo.py
from PIL import Image, ImageDraw, ImageFont
import os
import socket
import sys
import warnings

SRCDIR = "/home/rpi/e-Paper/RaspberryPi_JetsonNano/python"

sys.path.append(os.path.join(SRCDIR, "lib"))

# Suppress GPIO library warning:
with warnings.catch_warnings(action="ignore"):
    from waveshare_epd import epd2in13_V4

def get_ip_address():
    s = socket.socket(socket.AF_INET, socket.SOCK_DGRAM)
    s.connect(('8.8.8.8', 80))
    local_ip_address = s.getsockname()[0]
    s.close()
    return local_ip_address

picdir = os.path.join(SRCDIR, 'pic')
font16 = ImageFont.truetype(os.path.join(picdir, 'Font.ttc'), 20)
font24 = ImageFont.truetype(os.path.join(picdir, 'Font.ttc'), 24)
epd = epd2in13_V4.EPD()
epd.init()
image = Image.new('1', (epd.height, epd.width), 127)
draw = ImageDraw.Draw(image)
draw.text((10, 68), 'pion ip address', font = font16, fill = 0)
draw.text((10, 90), f'{get_ip_address()}', font = font24, fill = 0)
epd.display(epd.getbuffer(image))
epd.sleep()
print("OK")
EOF
source venv/bin/activate && python /tmp/ip-demo.py
OK
And here's what it looked like on the Pi:
Prototyping a Better Display
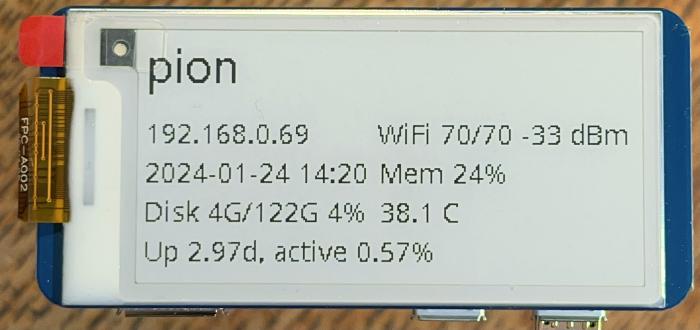
At this point I felt ready to make a more informative display panel. For this project I chose to display various information easily accessible to the Pi:
hostname- On-board temperature
- IP address
- WiFi signal strength
- Uptime, including CPU busy fraction
- "Disk" (storage) size and usage fraction
This meant reading online and running lots of little experiments to try things out. The RPi Zero W 2 is powerful enough to edit and run code on, but I'd rather use my editors on my laptop. I did need to explore the commands on the Pi needed to read out the quantities I was interested in… here are some of the details. (This section relies heavily on the the Literate Devops setup mentioned above; commands were all launched on the RPi from this document, with the results inserted directly inline.)
Temperature
On Raspbian, vcgencmd will tell you tons of things about your Pi.
Here we use it to read out the CPU temperature:
# On pion:
/usr/bin/vcgencmd measure_temp
temp=38.1'C
Memory
free is fairly common across Linux variants:
# On pion:
free
               total        used        free      shared  buff/cache   available
Mem:          436980      109240      213468         948      166464      327740
Swap:         102396           0      102396
It uses /proc/meminfo under the hood:
# On pion:
cat /proc/meminfo
MemTotal: 436980 kB MemFree: 111828 kB MemAvailable: 332116 kB Buffers: 31068 kB Cached: 220648 kB SwapCached: 1184 kB Active: 103120 kB Inactive: 159140 kB Active(anon): 10676 kB Inactive(anon): 32 kB Active(file): 92444 kB Inactive(file): 159108 kB Unevictable: 0 kB Mlocked: 0 kB SwapTotal: 102396 kB SwapFree: 91900 kB Zswap: 0 kB Zswapped: 0 kB Dirty: 800 kB Writeback: 0 kB AnonPages: 10328 kB Mapped: 29968 kB Shmem: 164 kB KReclaimable: 27584 kB Slab: 43208 kB SReclaimable: 27584 kB SUnreclaim: 15624 kB KernelStack: 1040 kB PageTables: 1088 kB SecPageTables: 0 kB NFS_Unstable: 0 kB Bounce: 0 kB WritebackTmp: 0 kB CommitLimit: 320884 kB Committed_AS: 168456 kB VmallocTotal: 1622016 kB VmallocUsed: 7056 kB VmallocChunk: 0 kB Percpu: 416 kB CmaTotal: 262144 kB CmaFree: 86804 kB
Lots of interesting things here to try and understand someday… maybe.
WiFi
Searching around on online turned up two ways of getting WiFi signal strength:
# On pion:
 iwconfig wlan0
wlan0     IEEE 802.11  ESSID:"CornellCroft"
          Mode:Managed  Frequency:2.437 GHz  Access Point: F4:92:BF:7F:55:E4
          Bit Rate=72.2 Mb/s   Tx-Power=31 dBm
          Retry short limit:7   RTS thr:off   Fragment thr:off
          Power Management:on
          Link Quality=64/70  Signal level=-46 dBm
          Rx invalid nwid:0  Rx invalid crypt:0  Rx invalid frag:0
          Tx excessive retries:1  Invalid misc:0   Missed beacon:0
# On pion:
cat /proc/net/wireless
Inter-| sta-| Quality | Discarded packets | Missed | WE face | tus | link level noise | nwid crypt frag retry misc | beacon | 22 wlan0: 0000 61. -49. -256 0 0 0 1 0 0
I used the former.
Disk Space
df is at least 37 years old and works on almost anything Unix-like:
# On pion:
df -k
Filesystem 1K-blocks Used Available Use% Mounted on udev 81736 0 81736 0% /dev tmpfs 43700 932 42768 3% /run /dev/mmcblk0p2 122364296 4306628 111824324 4% / tmpfs 218488 0 218488 0% /dev/shm tmpfs 5120 8 5112 1% /run/lock /dev/mmcblk0p1 522232 95702 426530 19% /boot/firmware tmpfs 43696 0 43696 0% /run/user/1000
I only wanted the "root" filesystem, since it takes up almost all the space.
# On pion:
df -k | egrep '/$'
/dev/mmcblk0p2 122364296 4306624 111824328 4% /
I probably didn't need to spring for 128 GB of storage on my MicroSD card.
CPU Load and Uptime
I found two methods:
# On pion:
uptime
16:21:16 up 1:15, 2 users, load average: 0.08, 0.02, 0.01
# On pion:
cat /proc/uptime
4544.69 18031.09
What is this proc file actually telling us? RedHat says,
The first value represents the total number of seconds the system has been up. The second value is the sum of how much time each core has spent idle, in seconds. Consequently, the second value may be greater than the overall system uptime on systems with multiple cores.
This implies that there are four cores on the board (something one can
confirm by looking at /proc/cpuinfo); I actually didn't know there
were four cores when I bought the unit.
Which suggests an interesting statistic, "Average CPU load since boot": (4544 * 4 - 18031) / 4544 * 4 = 0.8%. I added that to my dashboard.
What else is there?
There are always interesting things to be found in the proc filesystem, which provides an easily-accessible file-like interface to many aspects of the Linux kernel.
# On pion:
ls /proc
1 1485 272 4 48 72 asound kallsyms stat 10 1486 275 40 49 73 buddyinfo key-users swaps 1012 1487 28 41 490 813 bus keys sys 1070 15 29 415 497 822 cgroups kmsg sysrq-trigger 1071 16 293 416 5 918 cmdline kpagecgroup sysvipc 11 164 294 42 50 939 consoles kpagecount thread-self 1155 167 3 421 503 94 cpu kpageflags timer_list 1158 168 315 422 53 941 cpuinfo latency_stats tty 1159 17 317 423 54 942 crypto loadavg uptime 12 18 319 424 577 945 device-tree locks version 1243 183 32 426 587 947 devices meminfo vmallocinfo 13 184 321 43 59 948 diskstats misc vmstat 1327 19 322 430 590 95 driver modules zoneinfo 133 2 33 433 6 951 execdomains mounts 14 22 35 434 60 952 fb net 140 228 36 435 61 96 filesystems pagetypeinfo 1411 23 374 436 62 967 fs partitions 1412 235 379 44 63 972 interrupts schedstat 1418 24 38 444 64 973 iomem self 1419 253 387 446 65 974 ioports slabinfo 1484 27 39 450 651 985 irq softirqs
Digging into these some other time might suggest more ideas for our
display. (Incidentally, I remember from my time writing Linux device
drivers that it is not that hard to add /proc entries to the kernel
– making a new proc file can be a good first kernel project.)
Building the Mockup
With the above output snippets in hand I could go about building a mockup to play around with locally on my laptop, then adapt to the Pi by wiring in the actual shell commands in the appropriate places.
First, I created a new Python project for local use. The only extra
library needed was pillow, for image manipulation functions of the
kind used by the Waveshare demo.
I called my e-paper display paperproto:
# Locally, on my laptop:
cd /Users/jacobsen/Programming/Python
mkdir -p paperproto
cd paperproto
python -m venv venv
pip install pillow
The resulting code is up on GitHub. I won't go through the entire program, though it is based on the Python example I showed above. There are, perhaps, two interesting features. First, the elements in the display are organized in a simple table which makes it easy to play with the layout. Here is the top-level table:
fields = [
    [None, get_hostname(), font24, [0, 0]],
    [None, get_ip_address(), font14, [0, 40]],
    ["WiFi", get_wifi_strength(), font14, [120, 40]],
    [None, get_datetime(), font14, [0, 60]],
    ["Mem", get_mem(), font14, [120, 60]],
    ["Disk", get_disk(), font14, [0, 80]],
    [None, get_temp(), font14, [120, 80]],
    ["Up", get_uptime(), font14, [0, 100]],
]
The first field is an optional prefix for the information; the next, an invocation of the relevant function to give the info in question; followed by the font/size for the information. The last column consists of $x$, $y$ location. By playing with these fields, the design could be quickly changed.
Second, each of the functions shown has a "mockup" or local version, a fixed string which was copied from the exploratory output shown above; and a "real" or deployed version which executes on the Raspberry Pi when it's running "in production." Here is an example of one of the functions implemented in this dual manner:
def get_uptime():
    if is_pi:
        uptimestr = subprocess.check_output("cat /proc/uptime", shell=True).decode(
            "utf-8"
        )
    else:
        uptimestr = """
        4544.69 18031.09
        """
    match = re.search(r"(\d+\.\d+)\s+(\d+\.\d+)", uptimestr)
    if not match:
        return "NO UPTIME"
    total_seconds = float(match.group(1))
    idle_cores = float(match.group(2))
    up_days = float(total_seconds / 86400)
    active_percent = float((1 - idle_cores / (4 * total_seconds)) * 100)
    return f"{up_days:.2f}d, active {active_percent:.2f}%"
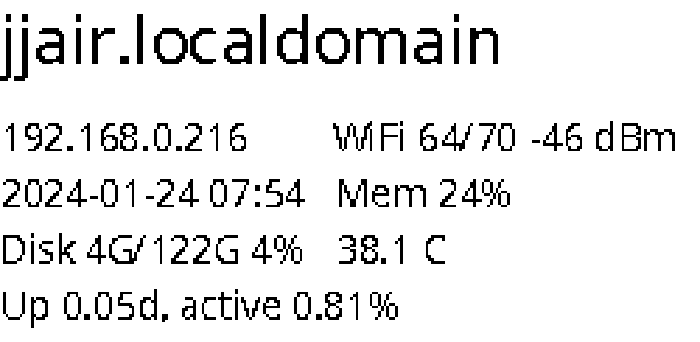
This separation of mockup or "virtual hardware," which can run anywhere, and the "real" or target hardware, is something I have had good success with in more serious embedded work. The result in this case is that I could iterate very quickly on my mockup, and produce something like the following, without taking the trouble to copy things over to the RPi:
(jjair is the hostname of my laptop, where the mockup is running.)
Deployment
Getting it to work on the Pi was as simple as copying the file over…
# Locally, on my laptop:
scp /Users/jacobsen/Programming/Python/paperproto/proto.py pion:
… and making a small wrapper script to activate the virtualenv and run the Python code:
# On pion:
cat <<EOF > proto
#!/bin/bash
cd /home/rpi
source venv/bin/activate
python proto.py
EOF
chmod +x proto
Running "In Production"
Running It Periodically
We would like our display to regularly update and to survive reboots.
One option would be to create a long-running program which loops
forever, sleeping and then waking up to make its update. And you
could make a systemd service out of that, etc. But cron does this
sort of periodic thing wonderfully, and our wrapper script makes this
easy:
# On pion:
cat <<EOF > /tmp/cron
*/10 * * * * /home/rpi/proto >> /home/rpi/proto.out 2>&1
EOF
crontab /tmp/cron && rm /tmp/cron
With the Pi on my desk and the cron job installed, I can see the screen refreshing every ten minutes. Job complete!
Future Directions
Here are some things I'd like to try:
- Try a bigger display
- Look into wall-mounted displays
- Display remote info (weather, crime, financial, politics, …)
- Add sensors, e.g. air quality or room temperature, and make a display for those
- Make it battery powered! (But power consumption of Pis is somewhat high for that.)
- Build a case for it.
One final thing I might play with is partial updates to the display. Waveshare supports a partial update mode where the entire screen need not be redrawn when a region is changed. Such updates are a little more visually unobtrusive – as it is, the whole display flashes a few times when it updates.
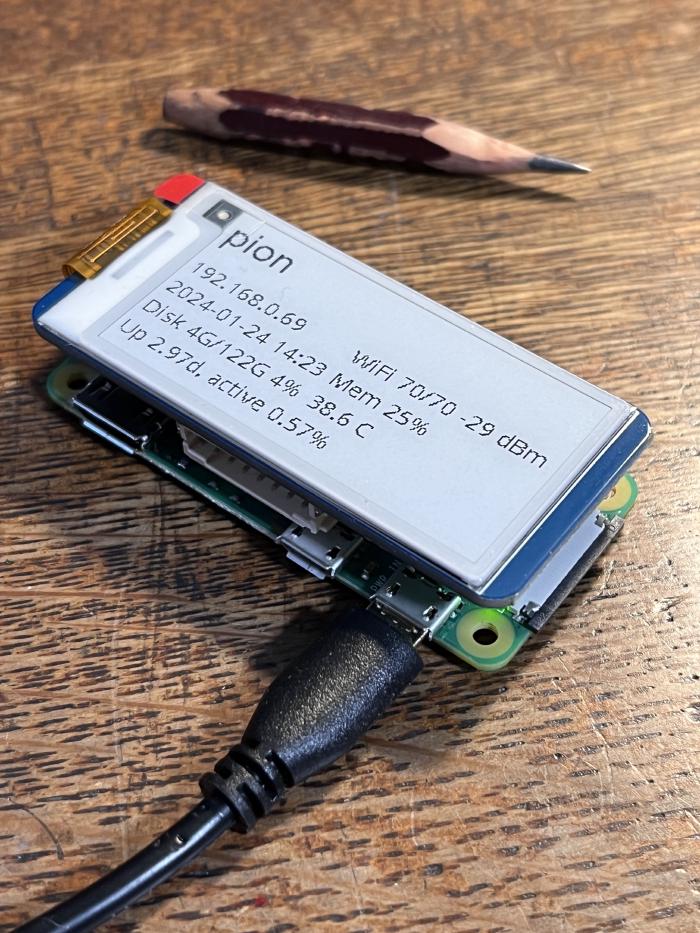
I've enjoyed having this little device on my desk this week. I can
ssh into it, poke around at the command line, shut it down and
unplug it, throw it in my backpack (wrapped in an ESD bag: no case yet!),
show it to friends. When unplugged, the information on the display
stays unchanged until you plug it in again, another nice e-paper
feature. Otherwise it just sits there quietly, refreshing every ten
minutes, drawing a small amount of power, and forming a tiny part of
my physical and digital world.
Later: eBook of Dreams
Earlier: In Praise of Small Shell Scripts
