Nucleotide Repetition Lengths
Later: Fun with Instaparse
Earlier: Updating the Genome Decoder
After a long hiatus, let’s continue our foray into amateur genomics with Clojure, in which we continue to encounter elegant expressions of Clojure’s power as well as a few additional wrinkles in the Clojure ecosystem (in this case, Incanter).
In our last post we upgraded our genome decoder and used it to show frequencies of the four nucleotides, illustrating Chargaff’s Rule.
Another simple question to be asked of the data is, What is the
distribution of nucleotide repetition lengths? In other words, if we
represent the number of times any nucleotide is repeated as a
histogram, then AAGGCATTTT would yield two entries for 1, two entries
for 2, zero for 3, and one for 4. What does this distribution look
like for the entire human or yeast genome?
As a “null hypothesis”, consider the likelihood of getting $N$ A’s when drawing at random from A, G, C or T. The probability for the first selection to be A is 25%; for the first two draws to be AA the probability is $P(AA) = {1 \over {4^2}} = 0.625$, and for $N$ consecutive draws, $P(A \times N) = 4^{-N}$.
You can easily simulate (“Monto Carlo”) such a situation using a purely random sequence:
(defn randgenome []
  (repeatedly #(rand-nth [:A :G :C :T])))
This function yields a sequence like (:A :A :C :A :T :G :G :T :G :A :C :C ...).
To convert this into repetition lengths, we can first divide the
sequence up into repeating elements using partition-by and the
identity function:
(partition-by identity (randgenome))
;;=> ((:A :A) (:C) (:A) (:T) (:G :G) (:T) (:G) (:A) (:C :C) ...)
Extracting the lengths is then trivial: just map count over the
sequences:
(defn get-lengths [s]
  (->> s
      (partition-by identity)
      (map count)))

(get-lengths (randgenome))
;;=> (2 1 1 1 2 1 1 1 2 ...)
(Note: running these functions unmodified will hang your REPL, since
randgenome yields an infinite sequence! Wrap them with take if
needed.)
Histogramming the data
The plots in my previous posts were made by the simple easy
expedient of copying data into a Numbers spreadsheet on my Mac. We’d
like to eventually do some more ambitious plotting, however, so let’s
investigate a Clojure-based solution.
Incanter provides a broad set of Clojure-based utilities for data analysis, including matrices and linear algebra operations, statistical distributions, and so on. Built on top of JFreeChart, it implements several different kinds of plots, including histograms, and it should be an obvious candidate for displaying our length distribution histogram.
Unfortunately, because of two issues I discovered, Incanter will not work for our purposes. To make a long story short, it does not handle empty (zero) entries in histograms properly when displaying on a logarithmic scale, and it generates out-of-memory errors when given more than a million or so entries. (Coming from high energy physics, where such histograms are extremely common, these both seem like serious flaws to me, which I hope will be remedied in the next Incanter release.)
I wound up using the JFreeChart API directly, though this was very time consuming, as the API has approximately the same complexity as the entire US space program or the Large Hadron Collider. (In what follows below I elide details about false starts, descriptions of hair pulling, and expletives.)
First, I needed to convert the lengths from get-lengths into a
histogram with arbitrarily many entries:
(defn make-hist
  "
  Convert seq of input xs into a histogram of nbins bins, from xmin to
  xmax.  Discard overflows or underflows
  "
  [xmin xmax nbins xs]
  (let [;; "base" histogram (zeros):
        zero-map (into (sorted-map)
                       (map (fn [x] [x 0]) (range nbins)))
        ;; get actual bin values for every input in xs:
        xbins (map #(int (* nbins (/ (- % xmin)
                                     (- xmax xmin))))
                   xs)
        ;; strip out undeflows & overflows:
        no-overflows (->> xbins
                          (remove #(< % 0))
                          (remove #(>= % nbins)))]
    ;; yield histogram as array of [ibin, height] pairs:
    (into [] (reduce #(update-in %1 [%2] inc) zero-map no-overflows))))
Supplying the minimum and maximum value ahead of time simplifies the histogramming code substantially and allows us to choose the same range for multiple plots, as will be shown below.
Armed with this transformation, the generation of the histogram plot is as follows:
(ns jenome.graphs
  (:import [org.jfree.data.xy XYSeriesCollection XYSeries]
           [org.jfree.chart ChartFrame JFreeChart]
           [org.jfree.chart.plot XYPlot]
           [org.jfree.chart.axis NumberAxis]
           [org.jfree.chart.renderer.xy XYBarRenderer StandardXYBarPainter]
           [org.jfree.chart.renderer.category]))

(defn trim-zeros
  "
  Convert zeros (or negatives) to small positive values to allow for
  graphing on log scale
  "
  [vals]
  (map (fn [[x y]] [x (if (> y 0) y 0.0001)]) vals))

(defn draw-hist
  "
  Draw histogram of bins as generated by make-hist
  "
  [x-label values]
  (let [renderer (XYBarRenderer.)
        painter (StandardXYBarPainter.)
        series (XYSeries. [])
        blue (java.awt.Color. 0x3b 0x6c 0x9d)
        coll (XYSeriesCollection. series)
        y-axis (org.jfree.chart.axis.LogarithmicAxis. "Entries")
        plot (XYPlot. coll (NumberAxis. x-label) y-axis renderer)
        panel (JFreeChart. plot)
        frame (ChartFrame. "Histogram" panel)]
    (doto plot
      (.setBackgroundAlpha 0.0)
      (.setRangeGridlinesVisible false)
      (.setDomainGridlinesVisible false))
    (doto renderer
      (.setBarPainter painter)
      (.setPaint blue)
      (.setDrawBarOutline true)
      (.setOutlinePaint blue)
      (.setOutlineStroke (java.awt.BasicStroke. 1))
      (.setShadowVisible false))
    (doseq [[x y] values]
      (.add series (+ x 0.5) y))
    (.setLowerBound y-axis 0.5)
    (.setVisible (.getLegend panel) false)
    (doto frame
      (.setSize 800 250)
      (.setVisible true))))
I will omit a detailed explanation of how draw-hist works because I’m
still not a JFreeChart expert (though if I do many more blog posts on
this topic I may be forced to become one, however reluctantly). The
principal difference with the Incanter implementation of histograms is
that we provide our own set of bin heights and simply plot those. This
follows a better separation of concerns anyways: our fairly simple
binning function remains separate from the visual presentation of the
bin positions and heights (we could, for example, add the counting of
overflows and underflows – this is left as an exercise to the reader).
(trim-zeros exists to transform bin values of zero to small positive
numbers to avoid taking the logarithm of zero, which is undefined.)
Armed with these tools, we can now make our first distribution:
(->> (randgenome)
     (take 1000000)
     get-lengths
     (make-hist 0.5 60.5 60)
     trim-zeros
     (draw-hist "Repeat Lengths, random hypothesis"))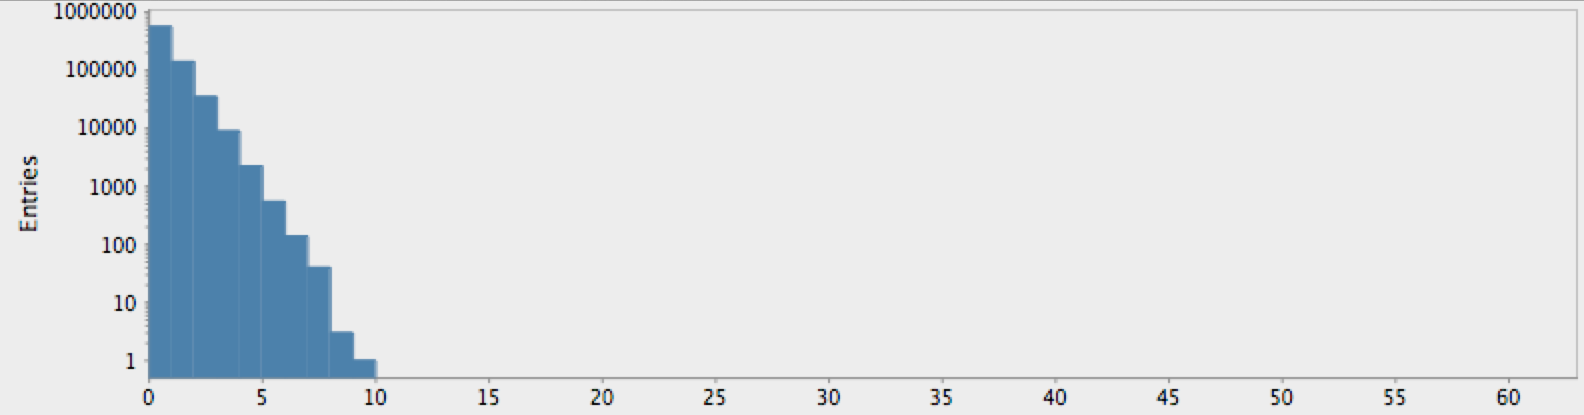
As expected by our analysis above, this shows the falling “power-law” distribution of randomly-occuring nucleotide repetitions. Compare this with the genome for the yeast S. Cerviciae:
(->> (genome-sequence yeast)
     get-lengths
     (make-hist 0.5 60.5 60)
     trim-zeros
     (draw-hist "Repeat Lengths, S. Cerviciae"))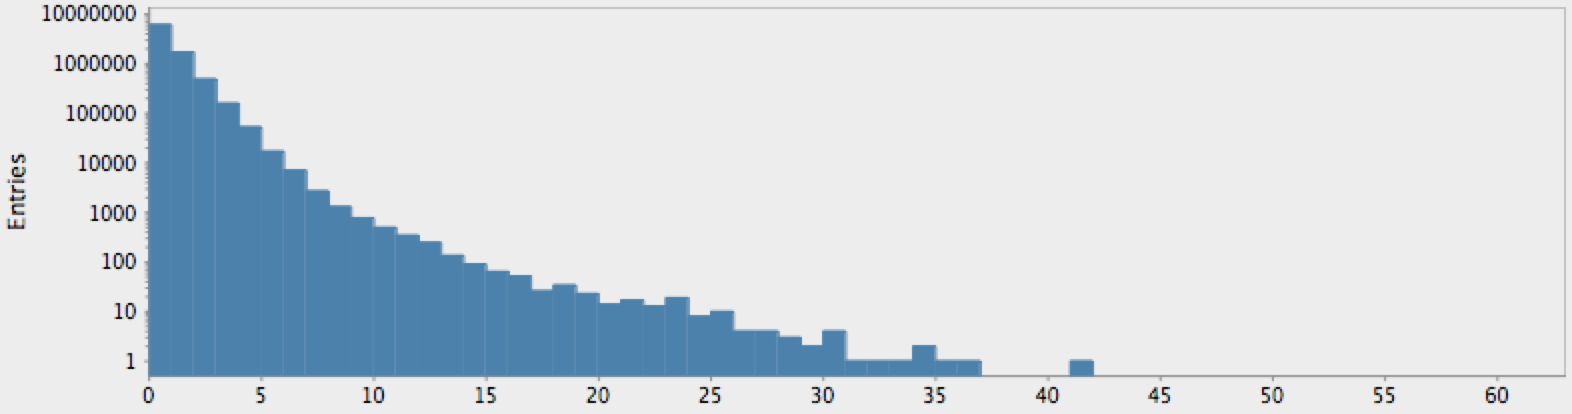
And, for humans (here we did not wait for the result for the entire genome):
(->> (genome-sequence human)
     (take 10000000)
     get-lengths
     (make-hist 0.5 60.5 60)
     trim-zeros
     (draw-hist "Repeat Lengths, human genome"))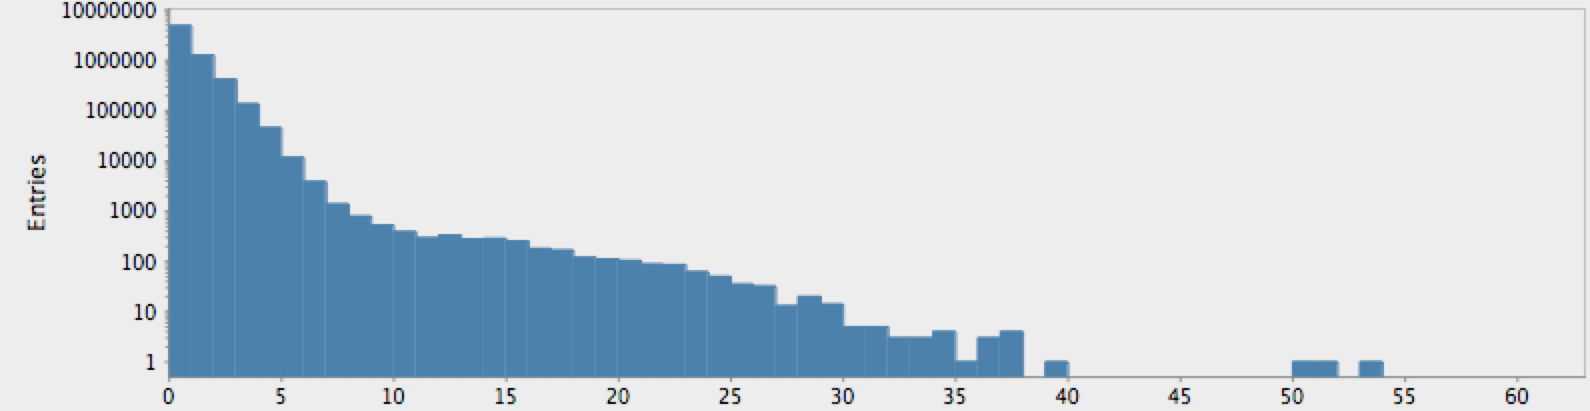
The actual genome data clearly deviate from our null hypothesis of randomness, as one might expect. However, these graphs raise more questions than they answer. In particular, note that there is a sort of bimodal characteristic or extended, secondary bump in the data for humans, with hints of an outlier feature on the tail which may or may not just be a statistical fluctuation.
One complicating factor we neglected is the role of “N-blocks”, which
should be eliminated without introducing artificially longer lengths;
e.g. ANNNNA with the Ns removed should be considered two 1-blocks
rather than a two-block AA group. This simple modification to
get-lengths is left as another exercise to the reader (the change does
not affect the resulting distributions).
A real biologist could no doubt tell us a lot about these distributions. Meanwhile, the latest code has been pushed to GitHub.
Later: Fun with Instaparse
Earlier: Updating the Genome Decoder